Defang Blog
Introducing the Docker Compose Visualizer
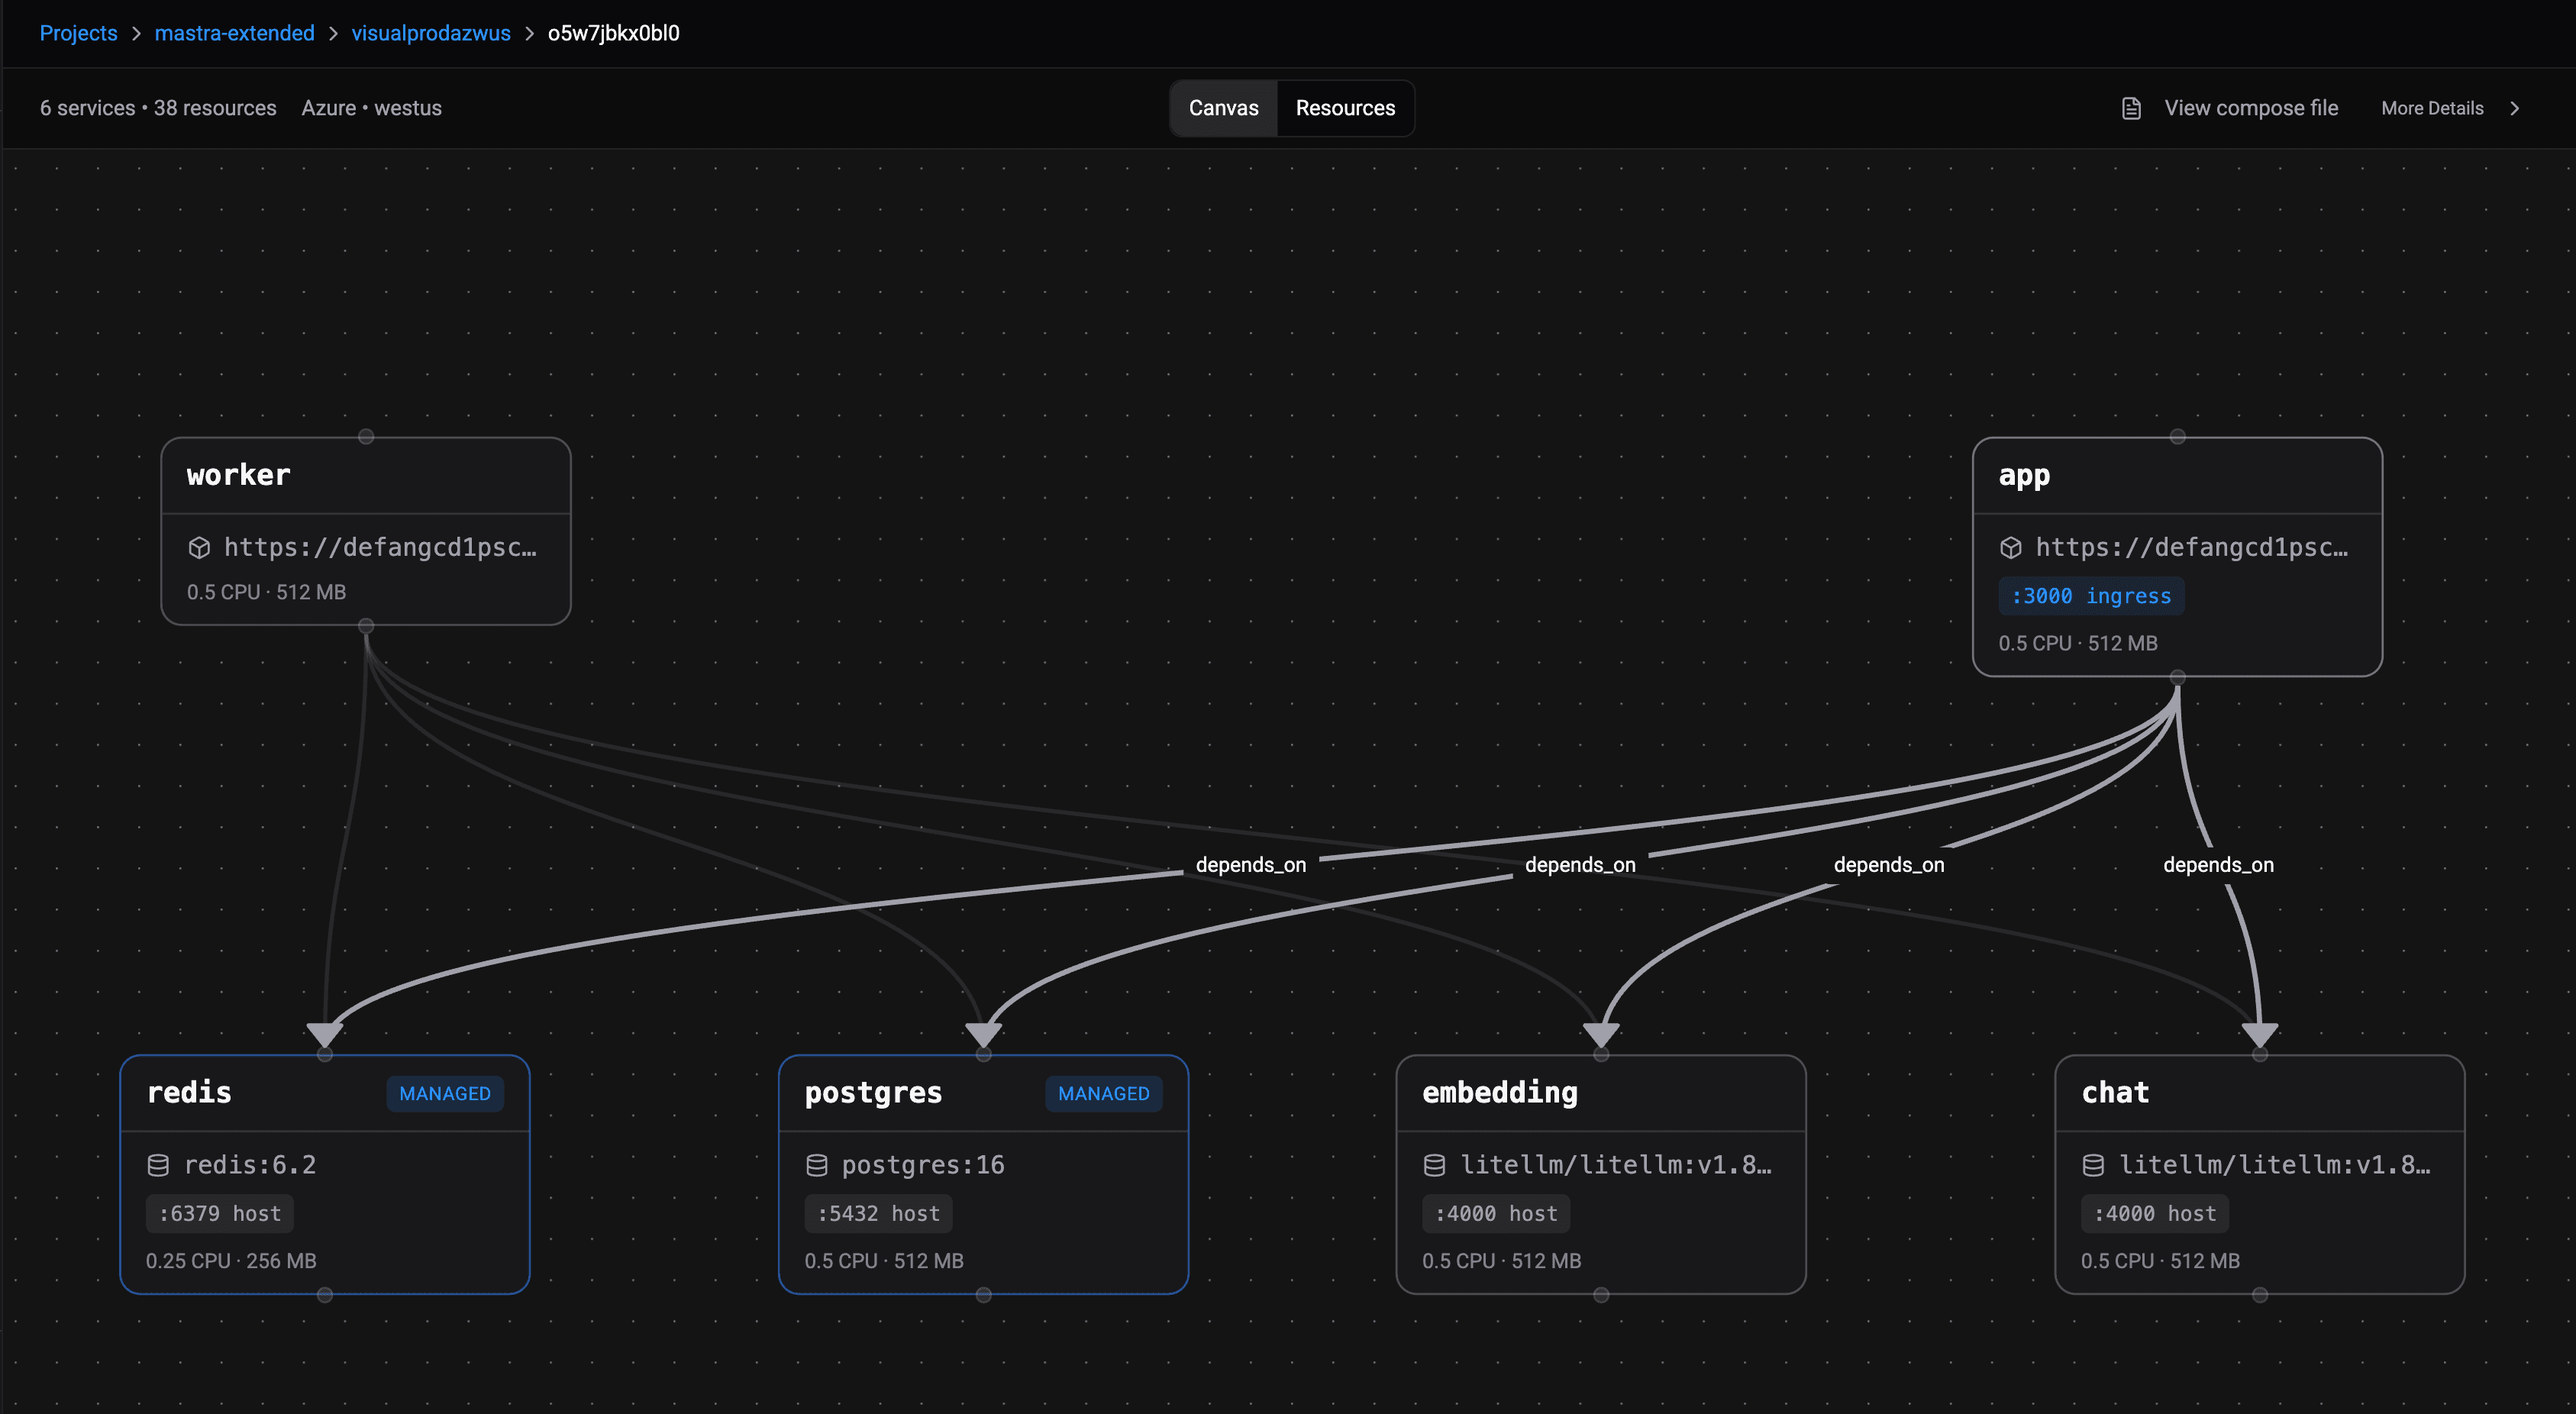
Understanding how your multi-service application connects can be challenging. The Docker Compose Visualizer provides an interactive, system-wide view of your deployed architecture, making cloud infrastructure more intuitive and accessible.
At any company, whether you're a solo developer, startup, or large engineering team, running a multi-service application can quickly become messy. You might have a frontend, backend, Redis, PostgreSQL, workers, and other services all running as separate services. Managing and keeping track of each service individually becomes tedious.
This is where Docker Compose shines.
With Docker Compose, you can define your entire application stack in a single file and bring everything up with one command:
docker compose up
Instead of manually managing each service separately, Docker Compose lets you describe your entire system architecture in one place. Your databases, caches, APIs, background workers, networking, environment variables, and dependencies are all logically organized together in one place.
So, if Docker Compose works locally, why shouldn't it work in the cloud?
That is exactly where Defang comes in.
Defang enables developers to deploy Docker Compose applications directly to the cloud with multi-cloud support across AWS, GCP, and Azure without requiring deep DevOps expertise. Defang takes the same Docker Compose file you use locally and instantiates a deep deployment to your account in any region, any cloud. You can read more about how Defang deploys Docker Compose applications in our white paper here.
But deploying is only part of the story.
Introducing the Docker Compose Visualizer
Once your system is deployed, understanding how everything connects can still be challenging especially for newer team members, junior developers, customers, or less technical stakeholders.
To solve this, we built the Docker Compose Visualizer.
The visualizer provides an interactive, system-wide view of your deployed architecture, helping teams better understand service relationships, dependencies, and infrastructure layout.
While Docker Compose YAML files are powerful, they can sometimes become difficult to understand as systems grow. Reading through service definitions, dependencies, ports, environment variables, and networking often requires developers to mentally reconstruct how the system fits together.
A diagram is simply easier to understand than YAML.
Instead of parsing through dozen or even hundreds of lines of configuration, developers can immediately see how services connect and depend on one another. What might take several minutes to piece together from a Compose file can be understood in seconds through a visual representation.
This becomes especially valuable when onboarding less knowledgeable Docker Compose developers, who may still be learning distributed systems and infrastructure concepts. Rather than explaining the application architecture entirely through YAML, teams can visually demonstrate how services interact, what depends on what, and how data flows across the system.
The visualizer is also useful for non-technical audiences. Whether explaining infrastructure to customers, product managers, leadership teams, or support staff, diagrams are significantly easier to understand than configuration files. Instead of explaining what depends_on means in Docker Compose, you can simply point to the visualizer and instantly show how components connect.
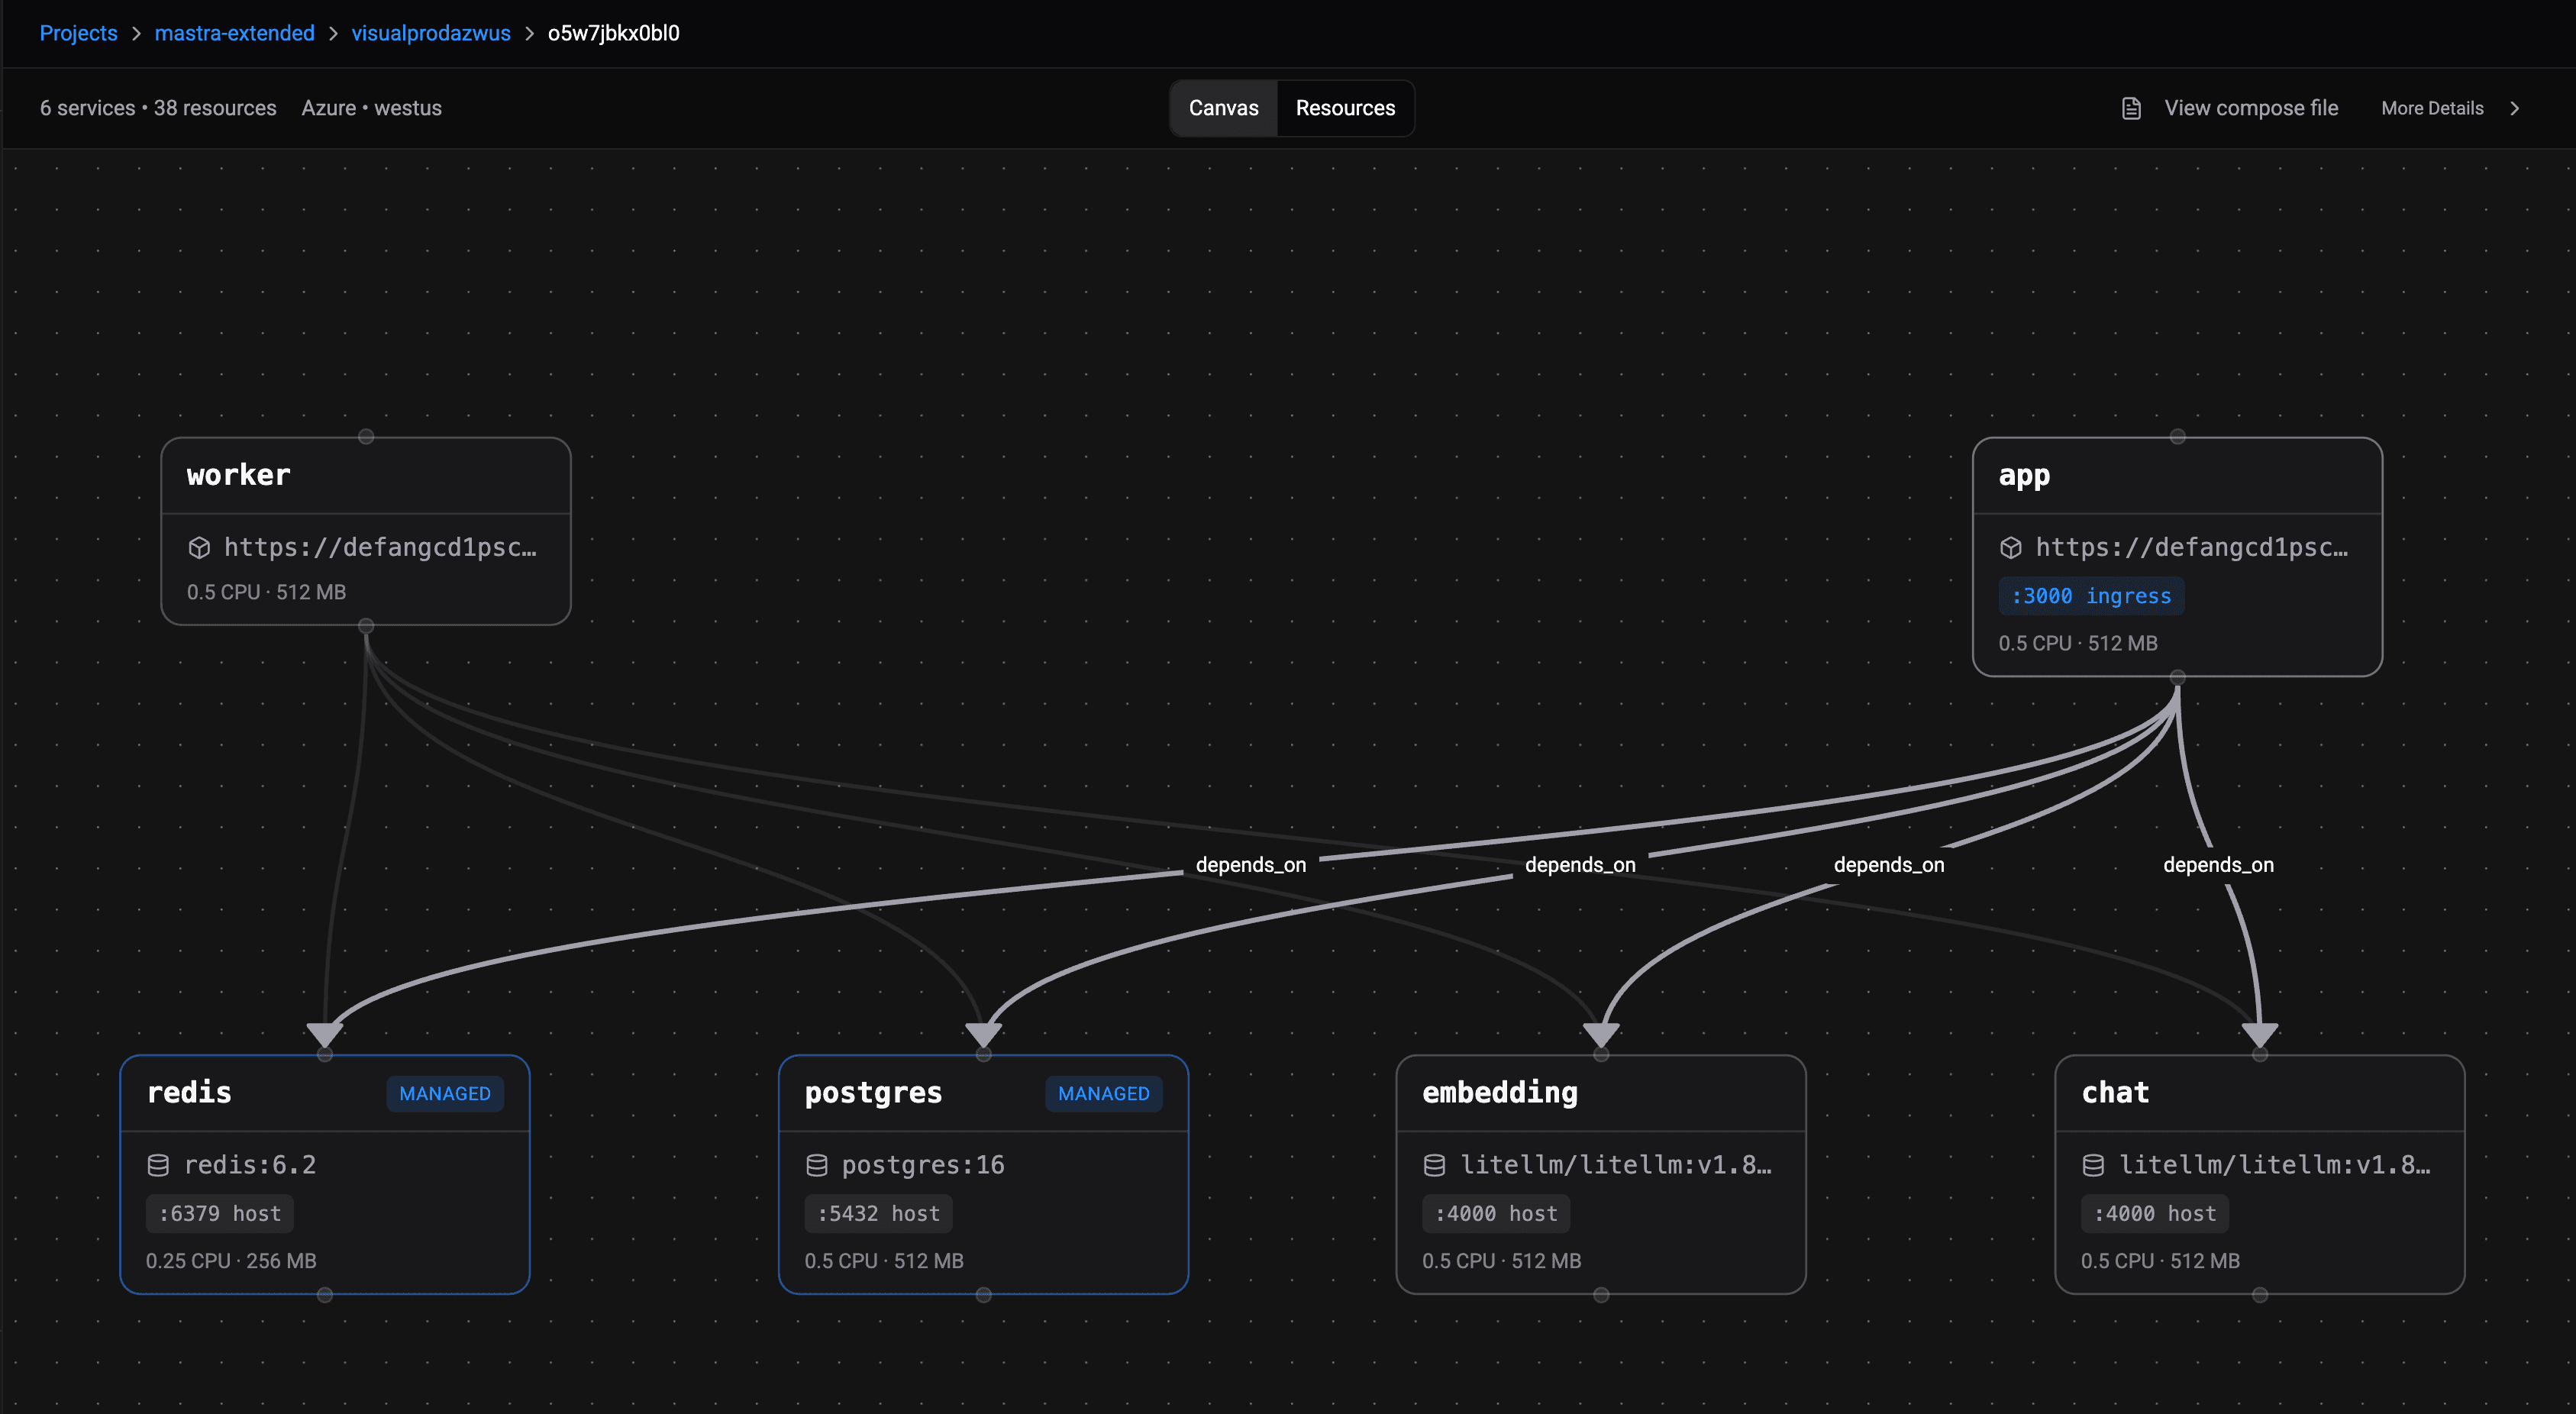
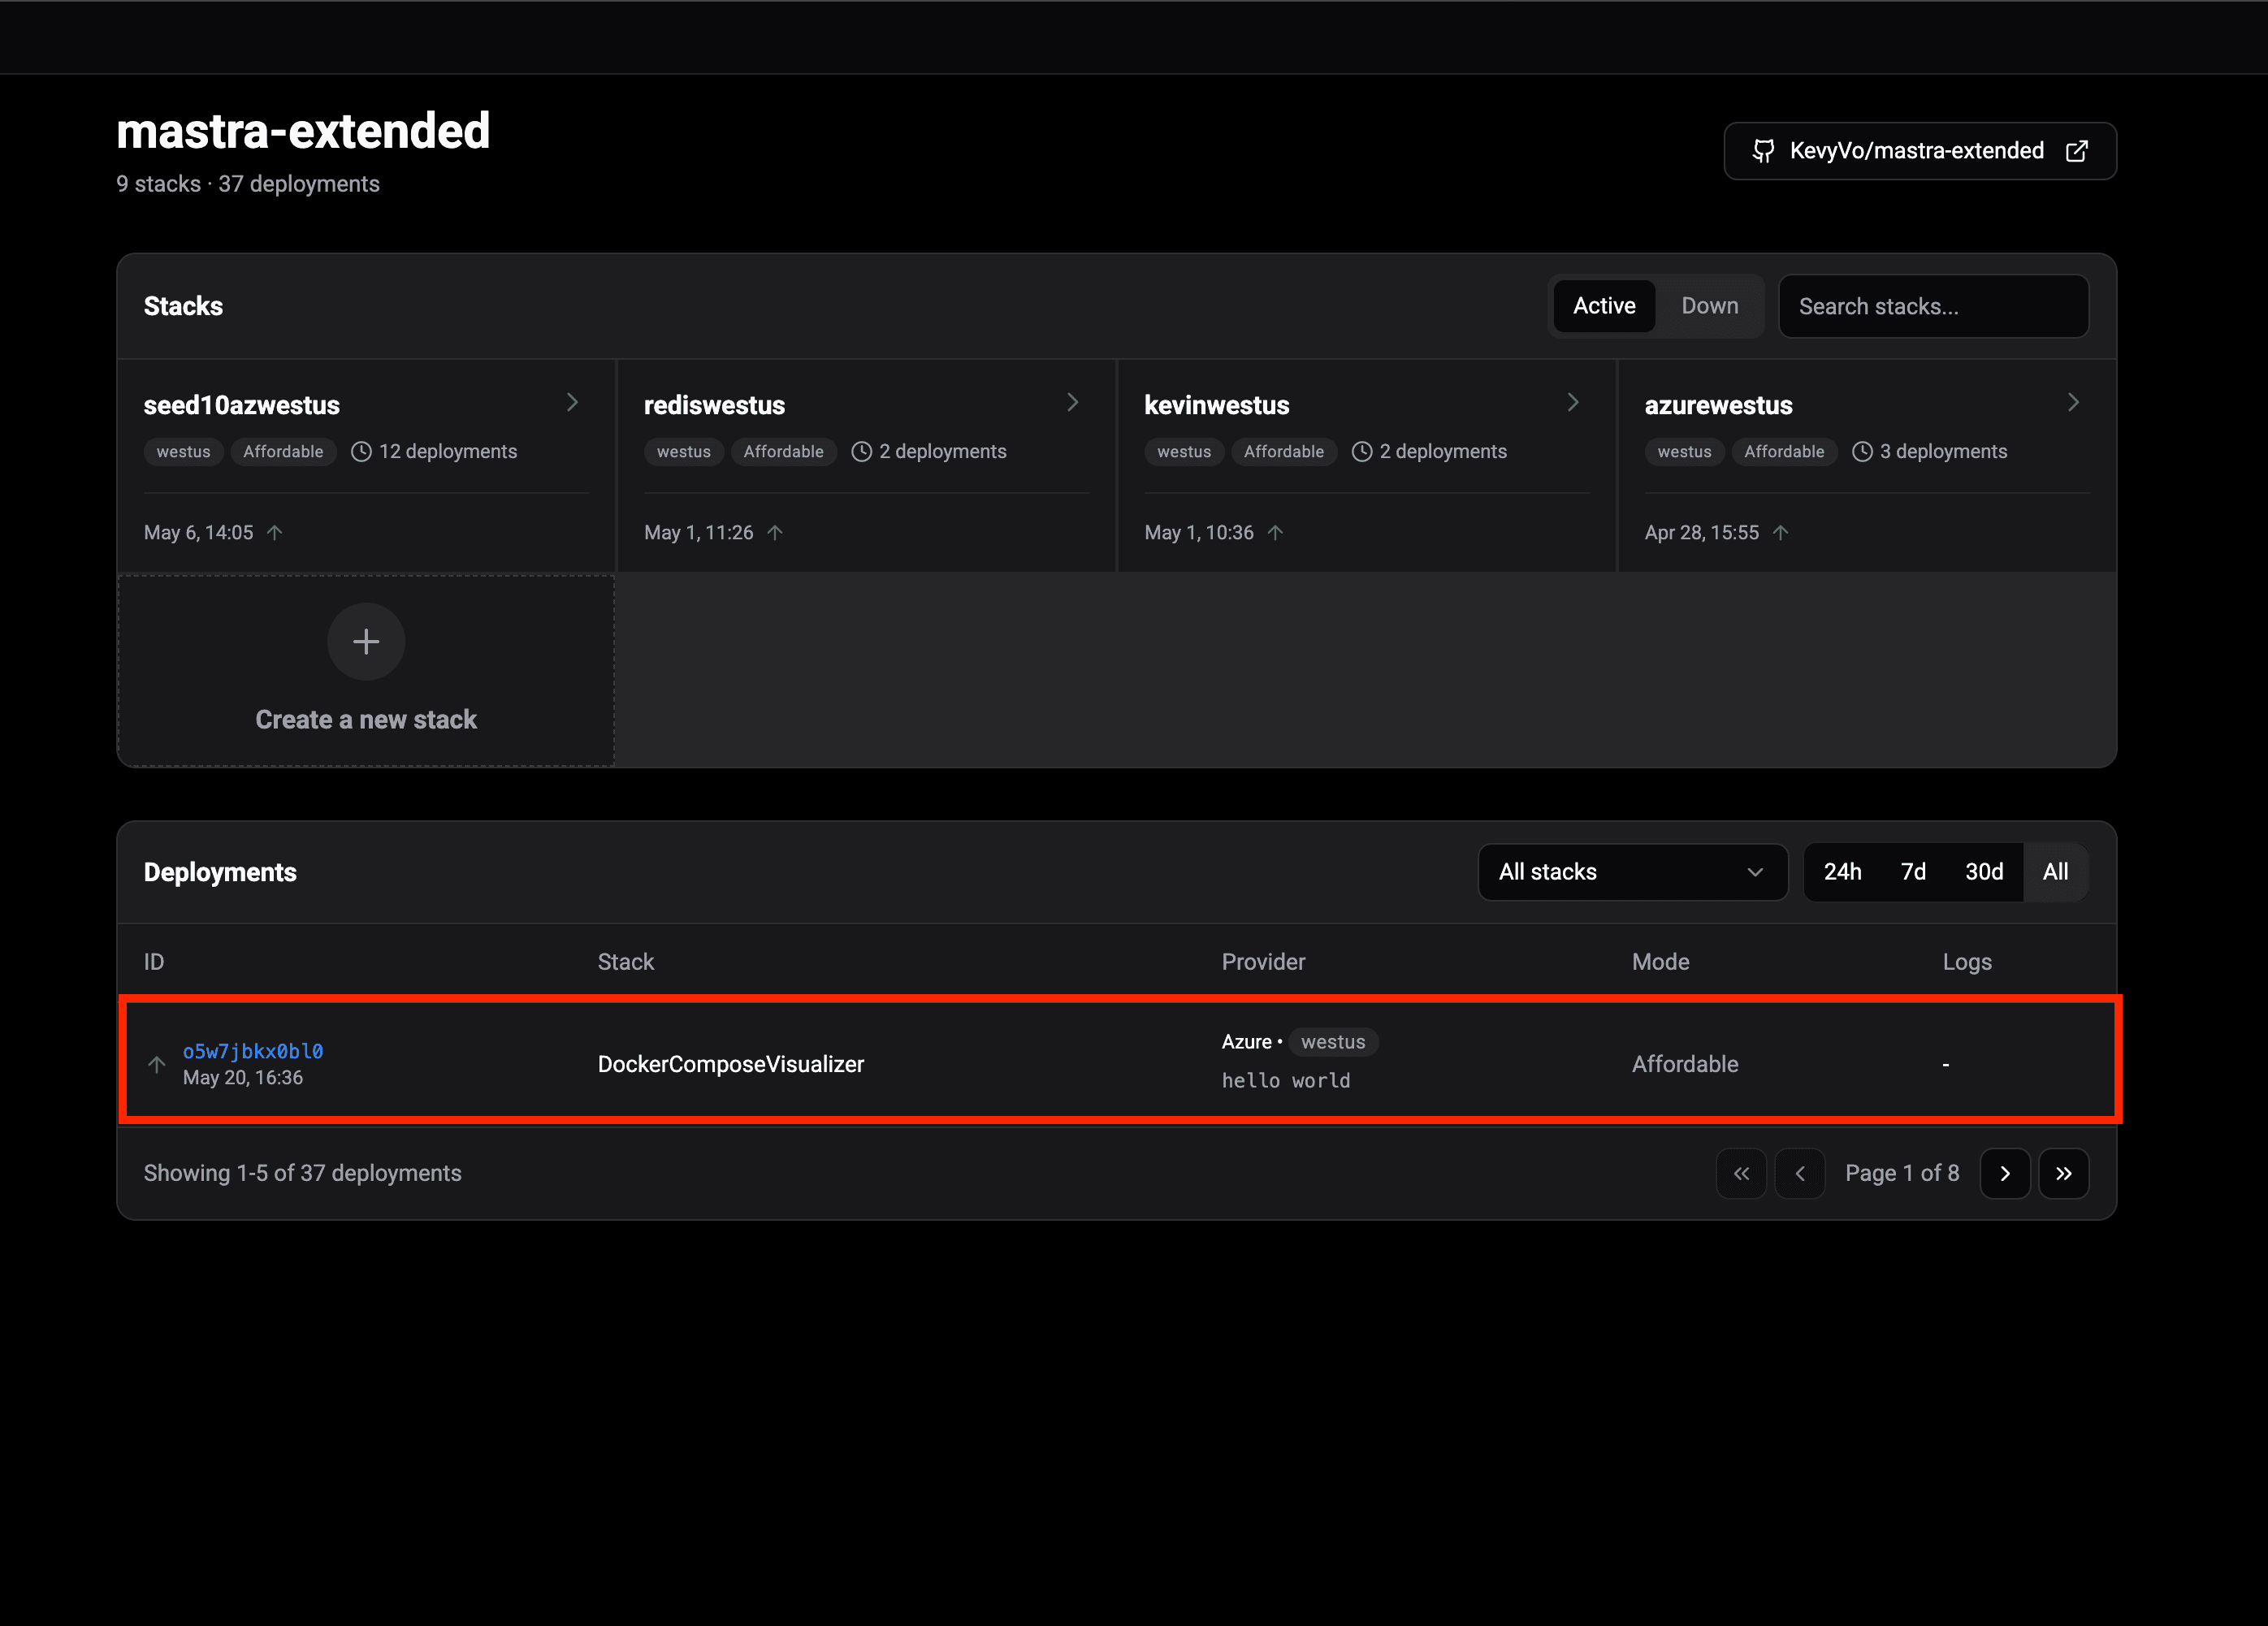
In the screenshots below you can see an example of a Mastra application expressed as a Docker Compose file and also how a deployment of this application looks in our Compose visualizer. The visualizer is now live in the Defang Portal - you can find it by going to an individual deployment for a given stack for a particular project.
At Defang, our goal is simple: if your application works locally, deploying and understanding it in the cloud should be just as easy. The Docker Compose Visualizer is another step toward making cloud infrastructure more intuitive, accessible, and easier for everyone to understand - technical or not.
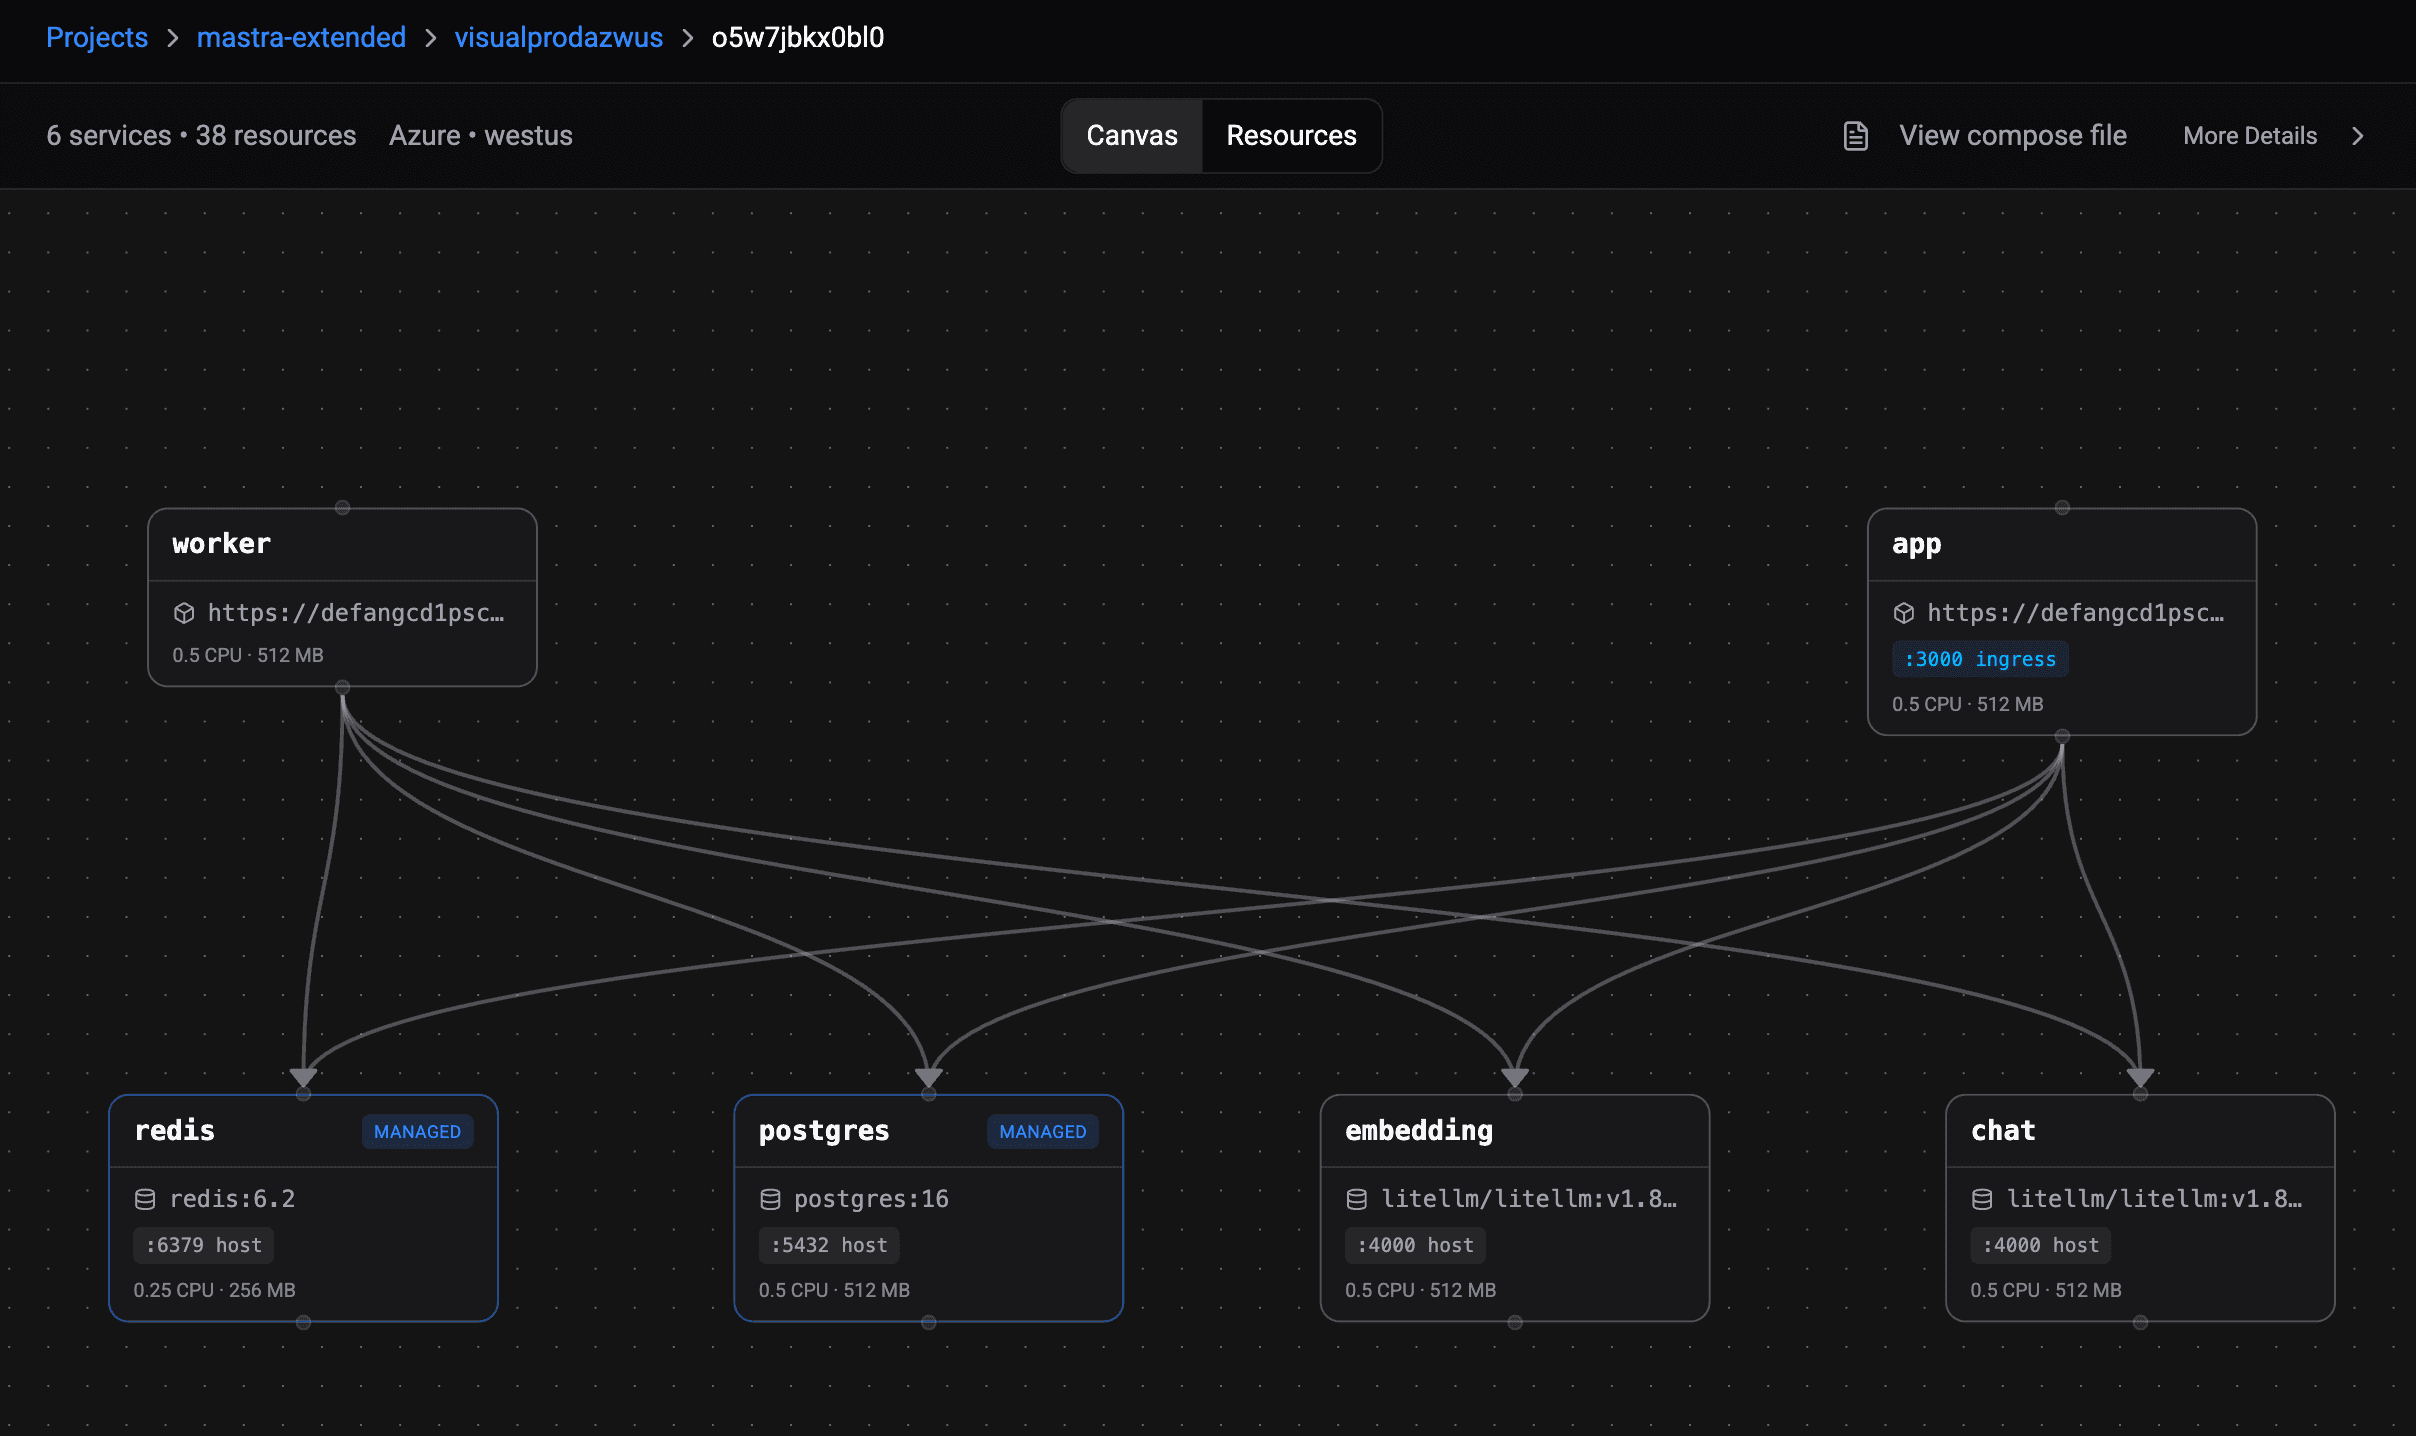
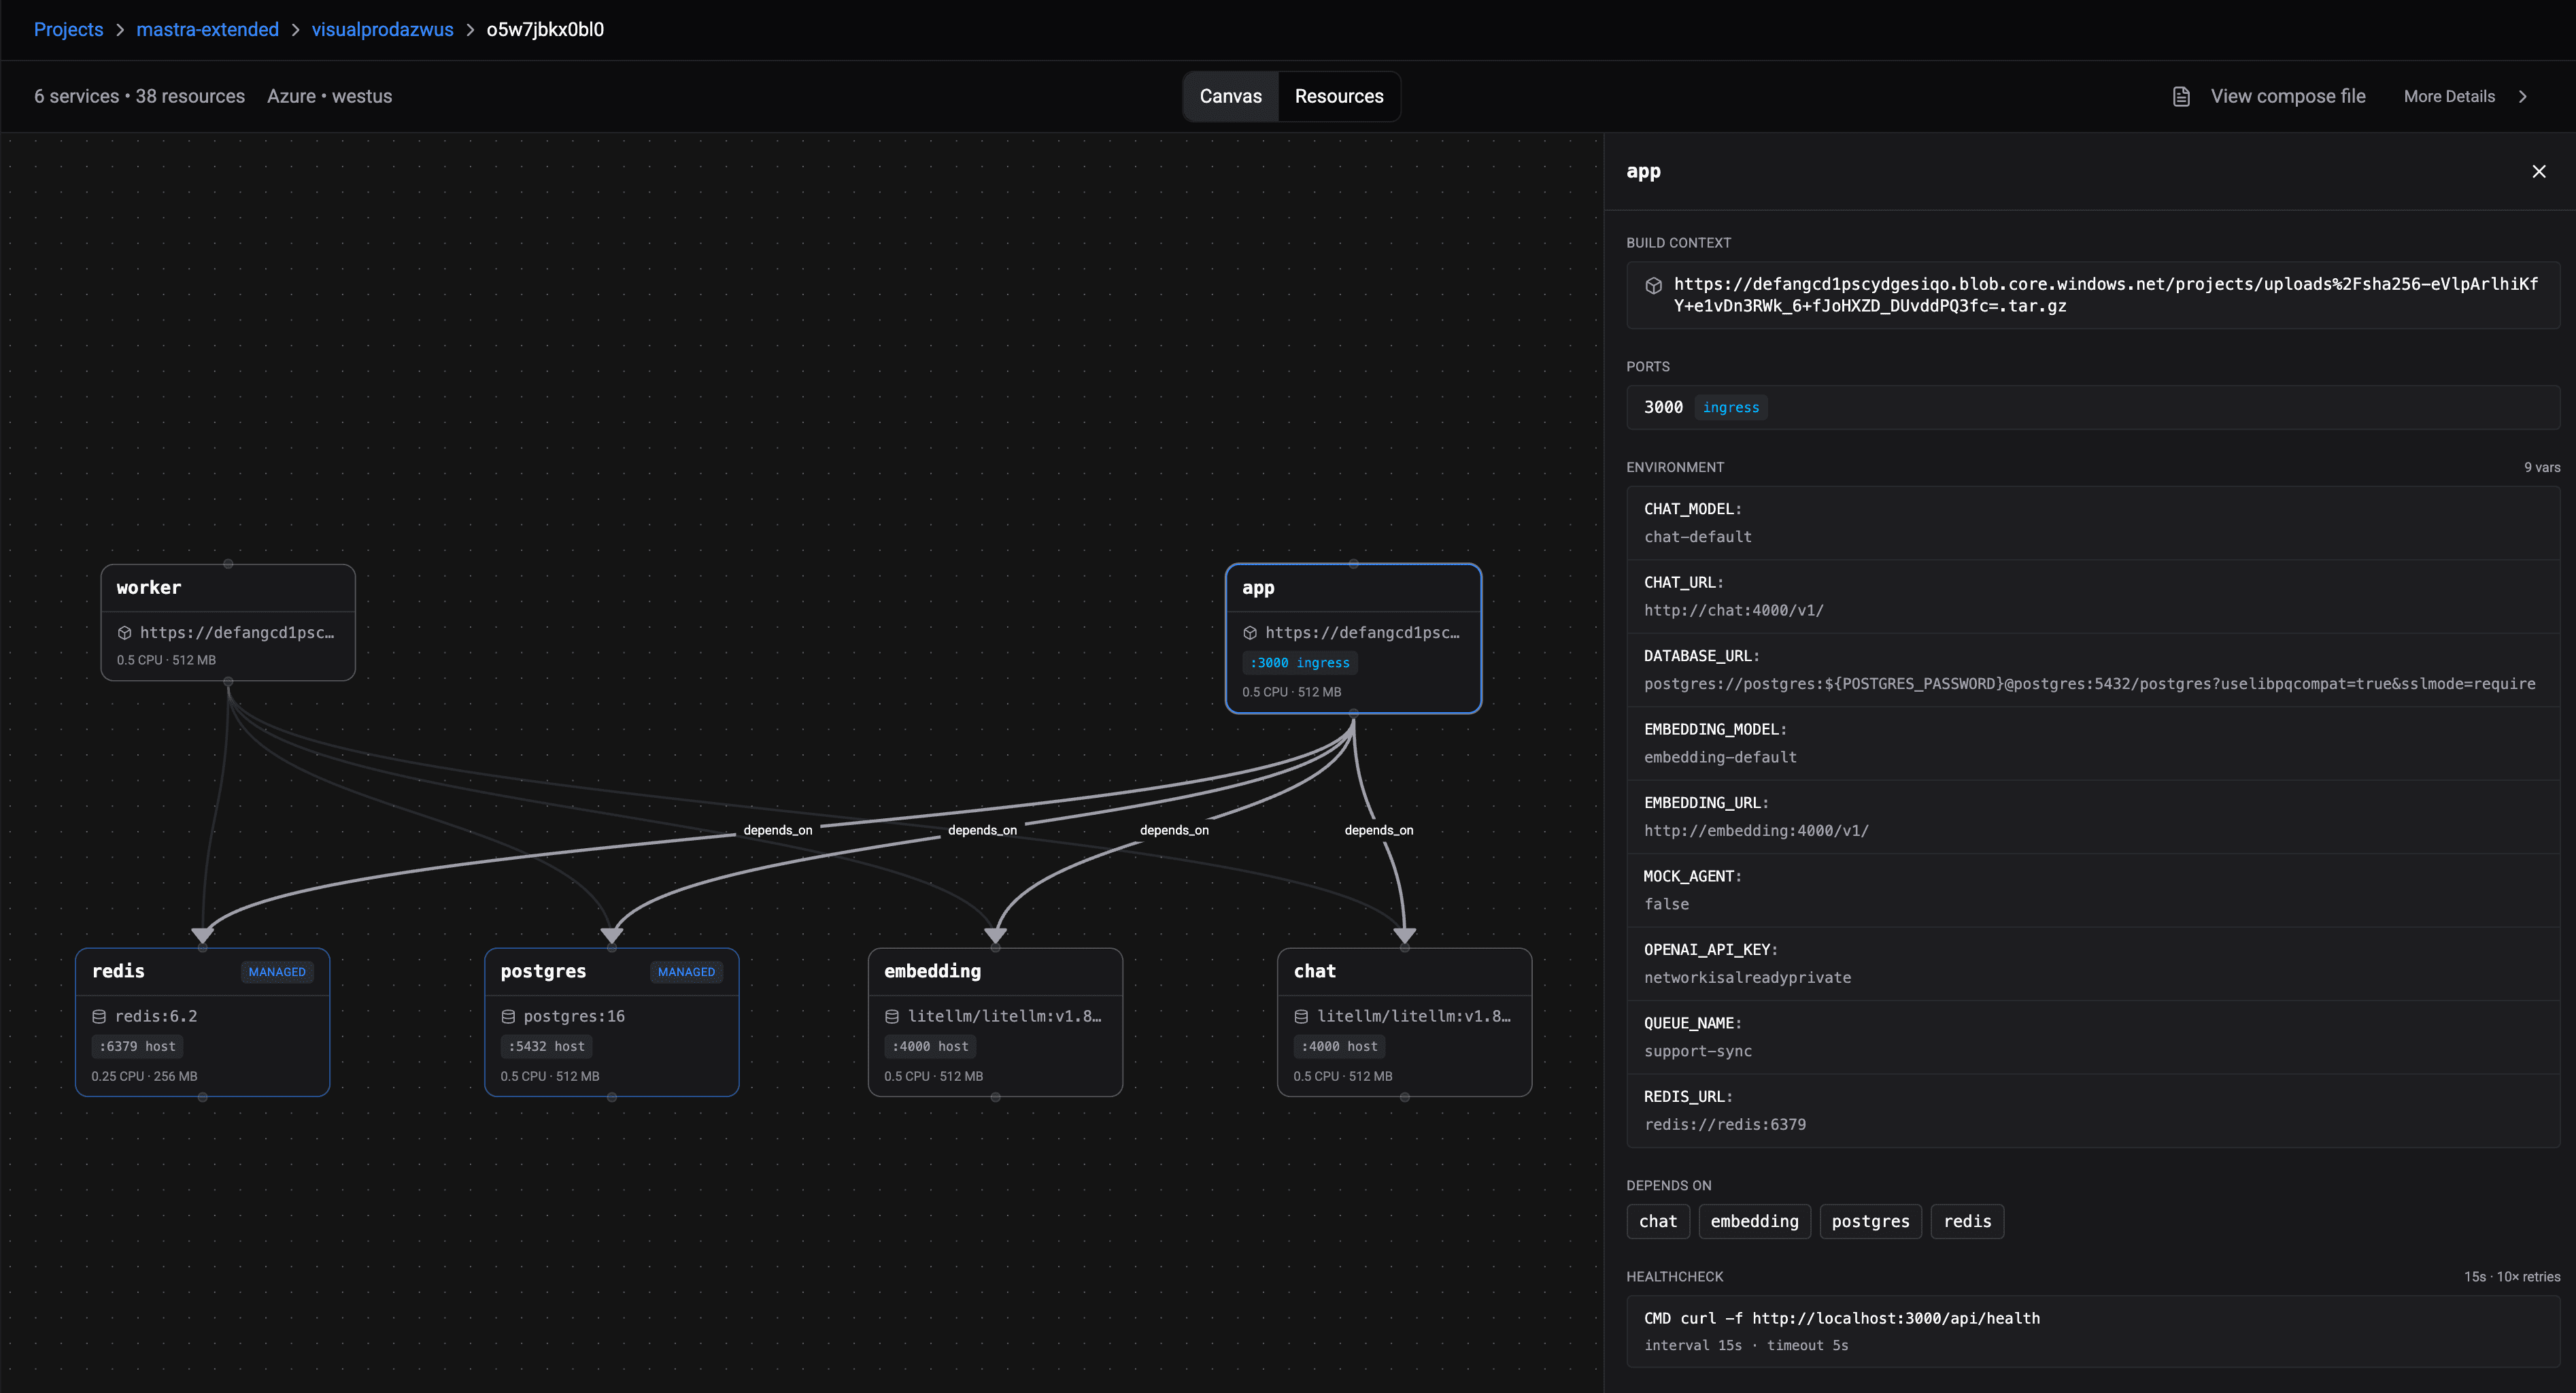
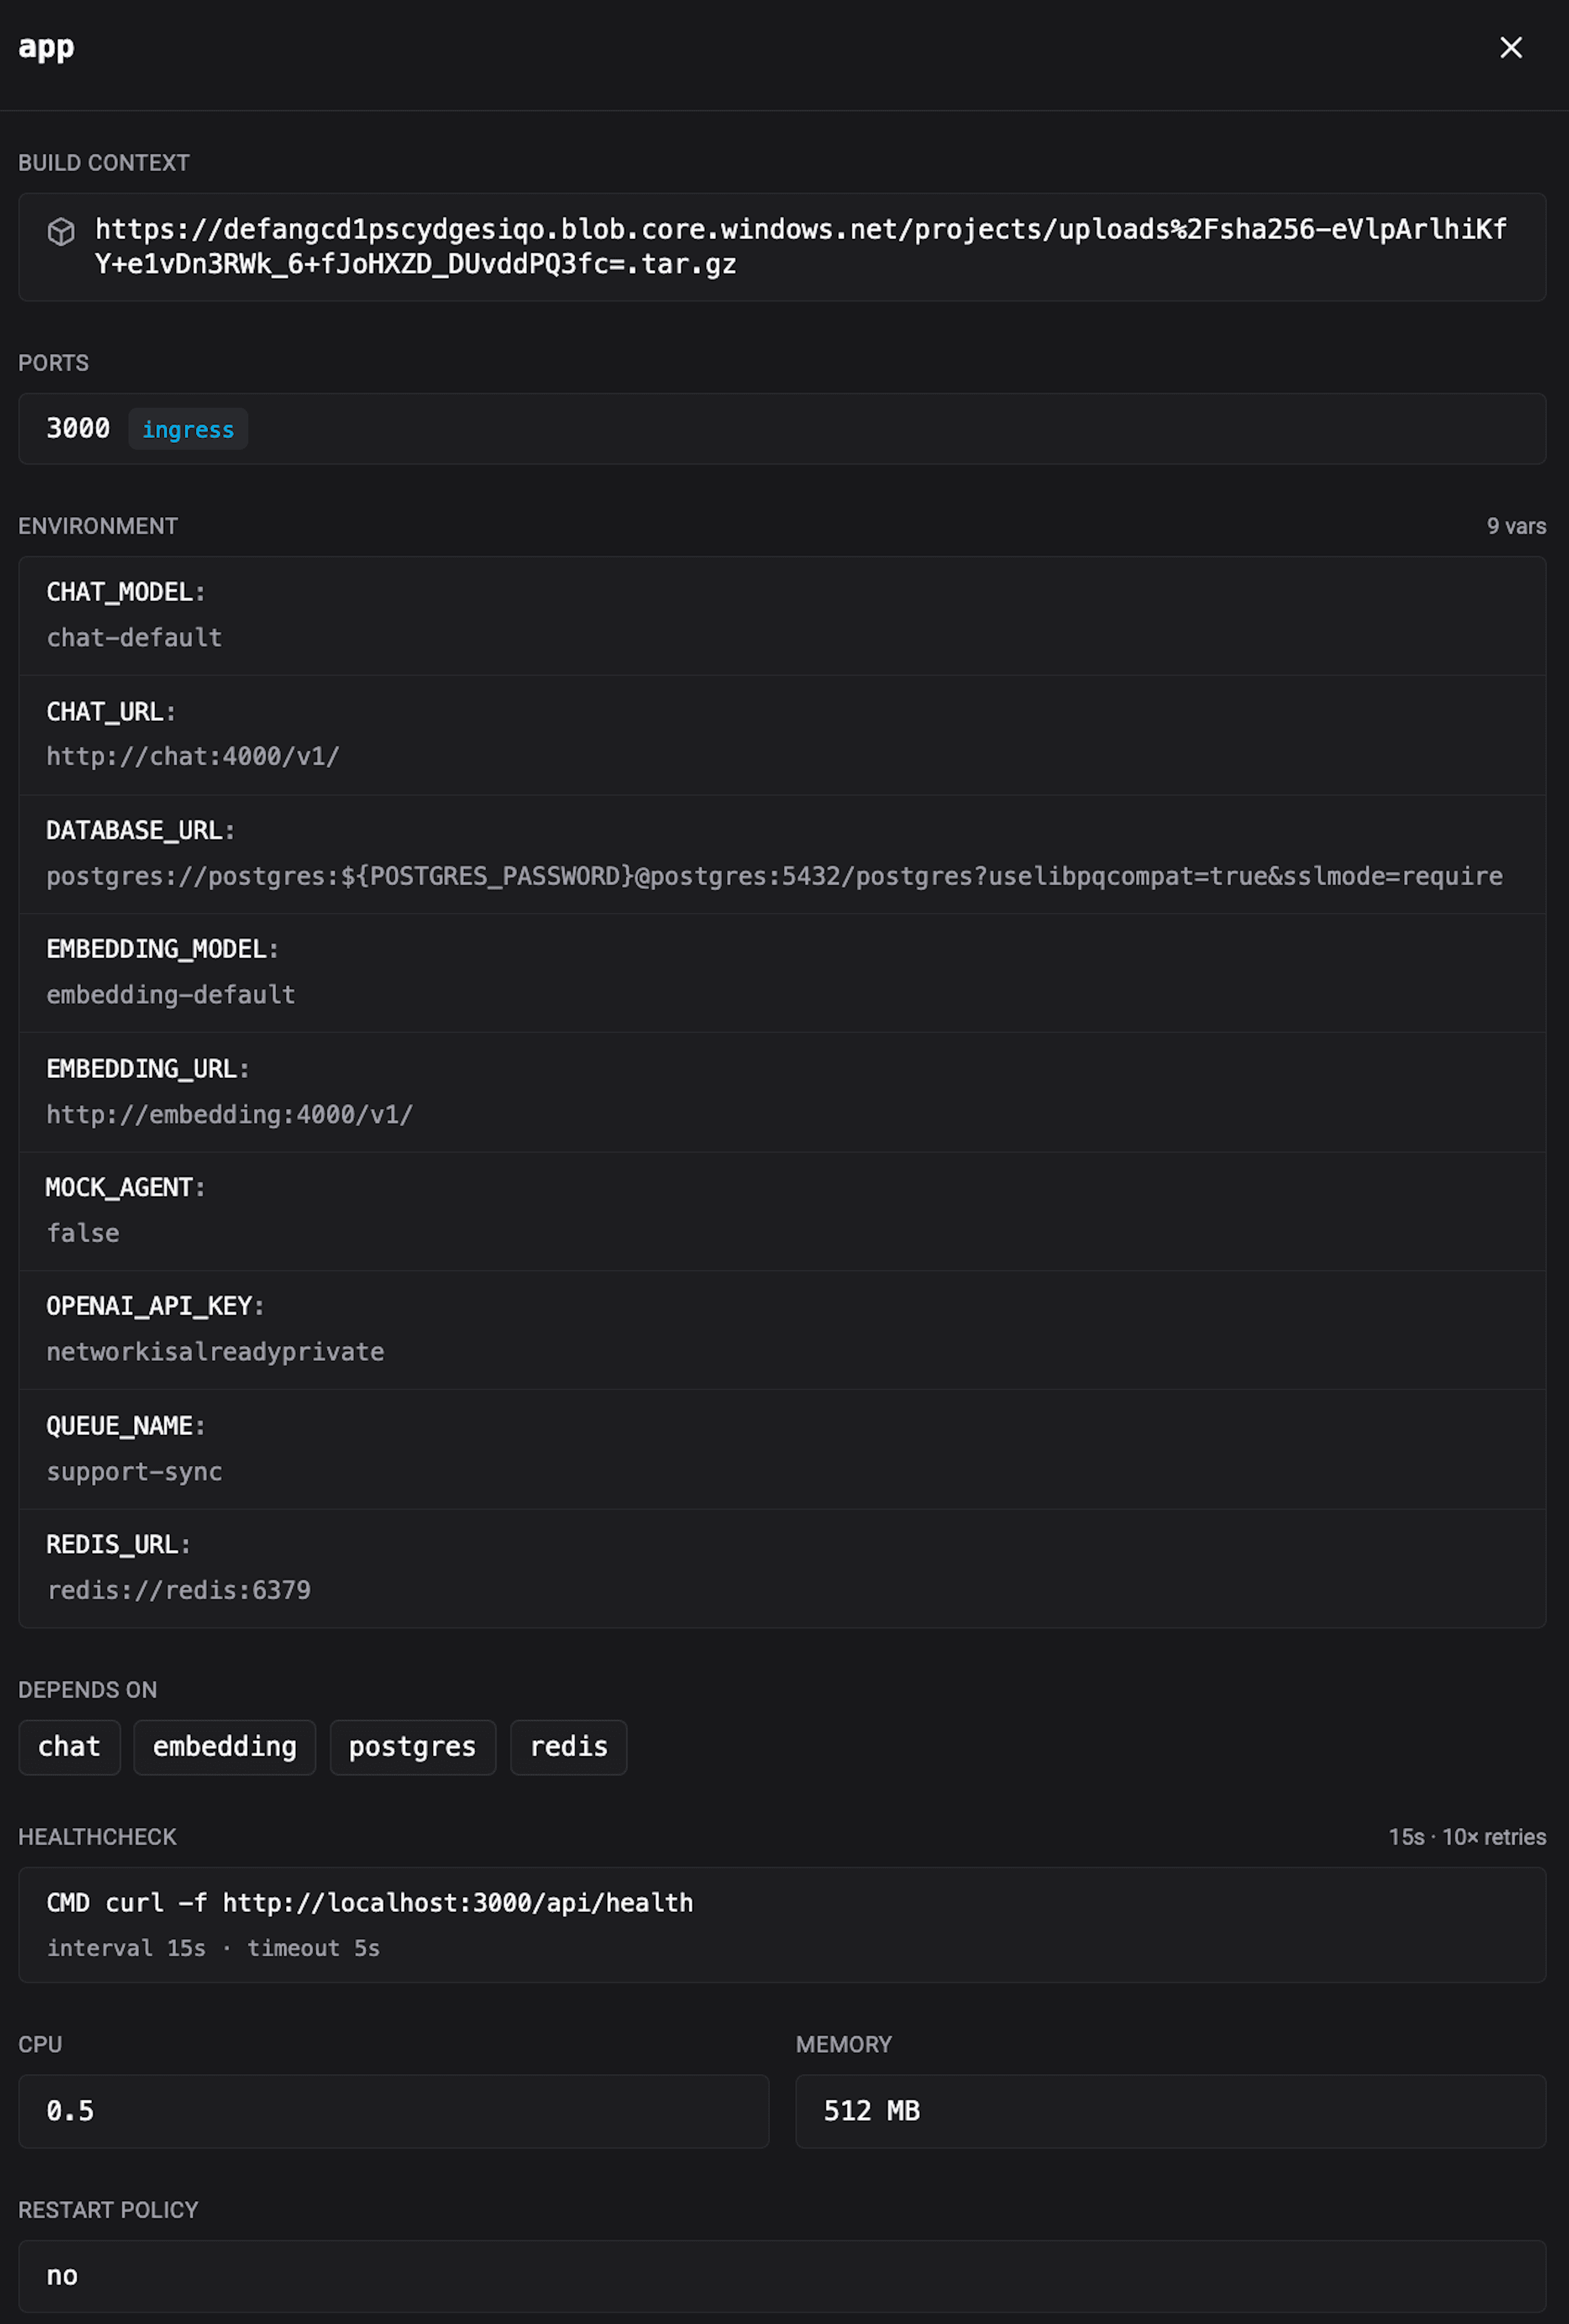
Here is the Compose file for the Mastra application shown above:
Related posts
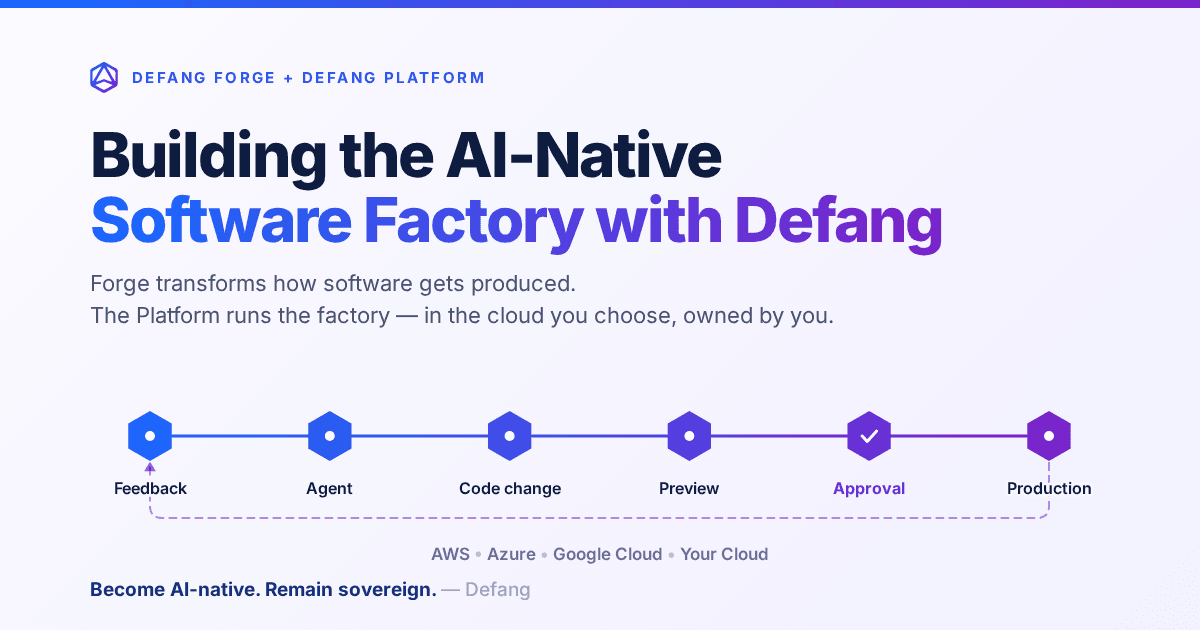
Building the AI-Native Software Factory with Defang
Building an AI-native software factory takes more than a coding agent. It takes people, agents, tools, infrastructure and governance working as one system—and it should belong to you. Here's how Defang Forge and the Defang Platform fit together.
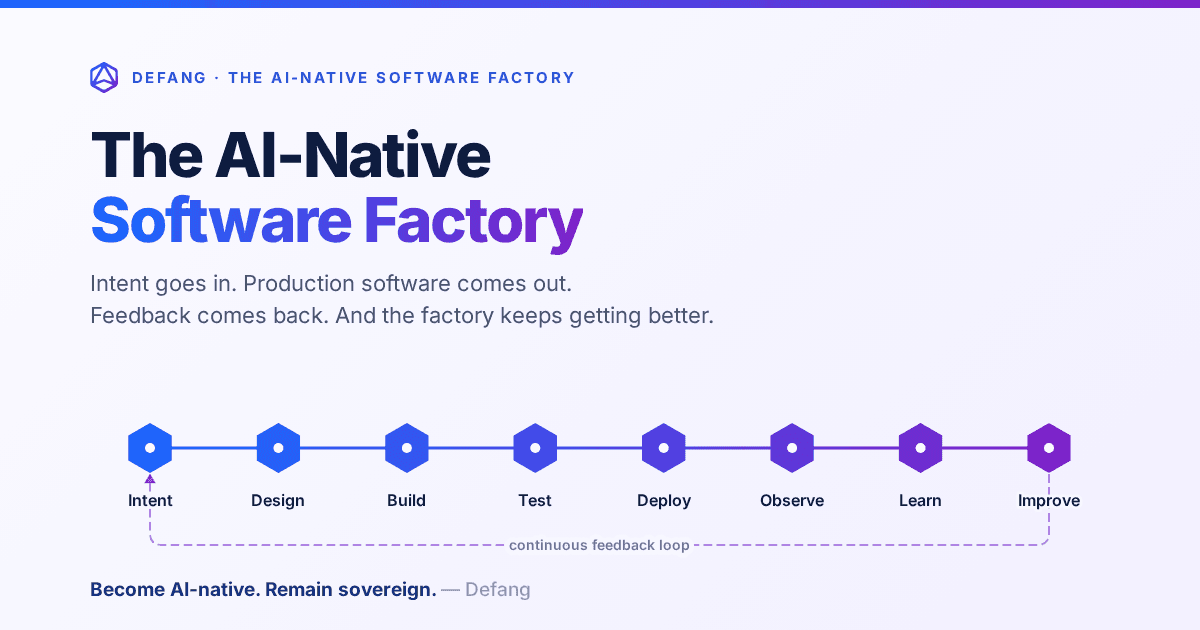
The AI-Native Software Factory
For decades, a true software factory was mostly aspirational. AI changes that: an end-to-end system that continuously turns intent into production software—and production feedback into the next improvement.
The AI-Native Enterprise: Redesigning Engineering for the AI Era
The next wave of competitive advantage won't come from adopting another AI tool. It will come from redesigning engineering around humans and AI agents working together, while preserving engineering sovereignty.